架构
此图说明了 Prometheus 的架构及其生态系统组件:
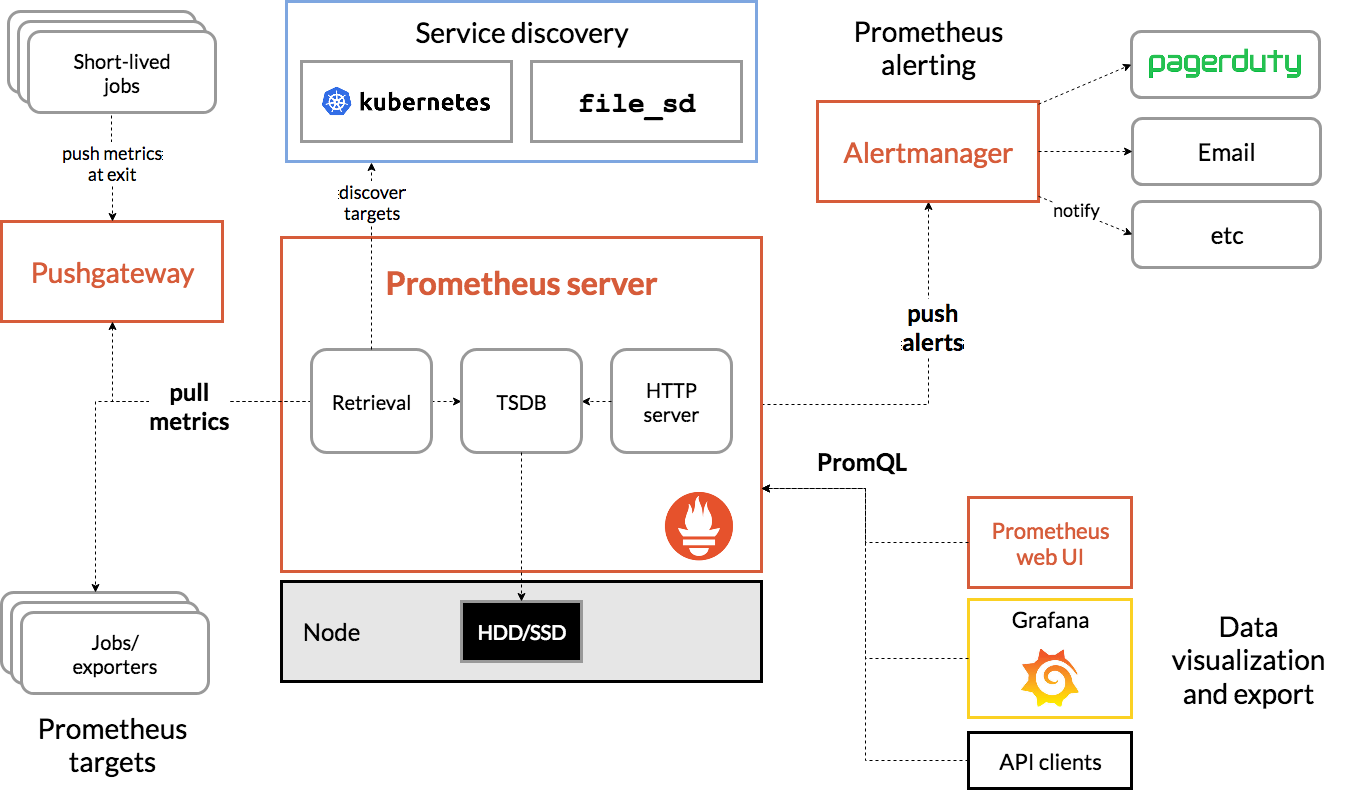
Prometheus scrapes metrics from instrumented jobs, either directly or via an intermediary push gateway for short-lived jobs. It stores all scraped samples locally and runs rules over this data to either aggregate and record new time series from existing data or generate alerts. Grafana or other API consumers can be used to visualize the collected data.
- 收集:Prometheus 从仪表化作业中直接或通过中间推送网关收集指标。
- 存储:它将所有采集的样本本地存储,并对这些数据运行规则,以从现有数据聚合和记录新的时间序列或生成警报。
- 展示:Grafana 或其他 API 使用者可用于可视化收集的数据。
scrape 收集信息
从架构中可以了解到,
收集信息,需要 target + prometheus server 一起配合处理
分为几种方案
- pull
- push
下面我们依次说明
1、pull
这里首先要描述一个概念叫做 Jobs and instances | Prometheus
在 Prometheus 术语中,您可以抓取的终端节点称为 instance ,通常对应于单个进程。具有相同目的的实例的集合(例如,为实现可伸缩性或可靠性而复制的进程)称为 job 。
注:instance 后面往往代表 target
例如,具有四个复制实例的 API 服务器作业:
- job:
api-server- target 1:
1.2.3.4:5670 - instance 2:
1.2.3.4:5671 - instance 3:
5.6.7.8:5670 - instance 4:
5.6.7.8:5671
- target 1:
配置说明
Prometheus collects metrics from targets by scraping metrics HTTP endpoints. Since Prometheus exposes data in the same manner about itself, it can also scrape and monitor its own health.
Prometheus 通过抓取指标 HTTP 终端节点从_目标_收集指标。由于 Prometheus 以相同的方式公开有关自身的数据,因此它还可以抓取和监控自己的健康状况。
While a Prometheus server that collects only data about itself is not very useful, it is a good starting example. Save the following basic Prometheus configuration as a file named prometheus.yml:
虽然仅收集有关自身数据的 Prometheus 服务器不是很有用,但它是一个很好的起点示例。将以下基本 Prometheus 配置保存为名为 prometheus.yml 的文件:
global:
  scrape_interval:     15s # By default, scrape targets every 15 seconds.

  # Attach these labels to any time series or alerts when communicating with
  # external systems (federation, remote storage, Alertmanager).
  external_labels:
    monitor: 'codelab-monitor'

# A scrape configuration containing exactly one endpoint to scrape:
# Here it's Prometheus itself.
scrape_configs:
  # The job name is added as a label `job=<job_name>` to any timeseries scraped from this config.
  - job_name: 'prometheus'

    # Override the global default and scrape targets from this job every 5 seconds.
    scrape_interval: 5s

    static_configs:
      - targets: ['localhost:9090']
这个配置说明,
- 全局
- 首先有一个全局的 scrape 间隔 15s
- 其次每一次抓取都会额外附加 label 为 monitor: codelab-monitor
- 配置
- 创建一个 job 名称叫做 prometheus
- 间隔 5s
- 目标之一, localhost:9090
- 默认路径是 /metrics
- 可以通过
[ metrics_path: <path> | default = /metrics配置
具体的配置详情可以看 Configuration | Prometheus
- 可以通过
exporter 导出器
对于很多服务,目前已经有相关的导出器,帮助进行数据的导出。
可以直接通过导出器在服务上提供 metrics 的接口,
通过 prometheus server 的 scrape 进行数据的捕获
2、push
GitHub - prometheus/pushgateway: Push acceptor for ephemeral and batch jobs.
When to use the Pushgateway
The Pushgateway is an intermediary service which allows you to push metrics from jobs which cannot be scraped. For details, see Pushing metrics.
Pushgateway 是一种中介服务,允许您从无法抓取的作业中推送指标。有关详细信息,请参阅推送指标 。
Should I be using the Pushgateway?
We only recommend using the Pushgateway in certain limited cases. There are several pitfalls when blindly using the Pushgateway instead of Prometheus’s usual pull model for general metrics collection:
我们只建议在某些有限的情况下使用 Pushgateway。 盲目使用 Pushgateway 而不是 Prometheus 通常的 pull 模型进行一般指标收集时,存在几个陷阱:
- When monitoring multiple instances through a single Pushgateway, the Pushgateway becomes both a single point of failure and a potential bottleneck.
当通过单个 Pushgateway 监控多个实例时,Pushgateway 既成为单点故障,又成为潜在的瓶颈。 - You lose Prometheus’s automatic instance health monitoring via the
upmetric (generated on every scrape).
您将失去 Prometheus 的自动实例运行状况监控,因为指标(在每次抓取时生成)。 - The Pushgateway never forgets series pushed to it and will expose them to Prometheus forever unless those series are manually deleted via the Pushgateway’s API.
Pushgateway 永远不会忘记推送到它的系列,并且会将它们永远暴露给 Prometheus,除非通过 Pushgateway 的 API 手动删除这些系列。
The latter point is especially relevant when multiple instances of a job differentiate their metrics in the Pushgateway via an instance label or similar. Metrics for an instance will then remain in the Pushgateway even if the originating instance is renamed or removed. This is because the lifecycle of the Pushgateway as a metrics cache is fundamentally separate from the lifecycle of the processes that push metrics to it. Contrast this to Prometheus’s usual pull-style monitoring: when an instance disappears (intentional or not), its metrics will automatically disappear along with it. When using the Pushgateway, this is not the case, and you would now have to delete any stale metrics manually or automate this lifecycle synchronization yourself.
当作业的多个实例通过实例标签或类似标签在 Pushgateway 中区分其指标时,后一点尤其相关。然后,实例的指标将保留在 Pushgateway 中,即使原始实例被重命名或删除。这是因为作为指标缓存的 Pushgateway 的生命周期从根本上与将指标推送到它的进程的生命周期是分开的。这与 Prometheus 通常的拉取式监控形成对比:当实例消失(有意或无意)时,其指标将自动随之消失。使用 Pushgateway 时,情况并非如此,您现在必须手动删除任何过时的指标或自己自动执行此生命周期同步。
Usually, the only valid use case for the Pushgateway is for capturing the outcome of a service-level batch job . A “service-level” batch job is one which is not semantically related to a specific machine or job instance (for example, a batch job that deletes a number of users for an entire service). Such a job’s metrics should not include a machine or instance label to decouple the lifecycle of specific machines or instances from the pushed metrics. This decreases the burden for managing stale metrics in the Pushgateway. See also the best practices for monitoring batch jobs.
通常,Pushgateway 的唯一有效用例是捕获服务级别批处理作业的结果 。“服务级别”批处理作业是指在语义上与特定计算机或作业实例无关的批处理作业(例如,删除整个服务的大量用户的批处理作业)。此类作业的指标不应包含计算机或实例标签,以将特定计算机或实例的生命周期与推送的指标分离。这减轻了在 Pushgateway 中管理过时指标的负担。另请参阅监控批处理作业的最佳实践 。
Alternative strategies
If an inbound firewall or NAT is preventing you from pulling metrics from targets, consider moving the Prometheus server behind the network barrier as well. We generally recommend running Prometheus servers on the same network as the monitored instances. Otherwise, consider PushProx, which allows Prometheus to traverse a firewall or NAT.
如果入站防火墙或 NAT 阻止您从目标中提取指标,请考虑将 Prometheus 服务器也移动到网络屏障后面。我们通常建议在与受监控实例相同的网络上运行 Prometheus 服务器。否则,请考虑 PushProx,它允许 Prometheus 遍历防火墙或 NAT。
For batch jobs that are related to a machine (such as automatic security update cronjobs or configuration management client runs), expose the resulting metrics using the Node Exporter’s textfile collector instead of the Pushgateway.
对于与计算机相关的批处理作业(例如自动安全更新 cronjobs 或配置管理客户端运行),请使用 Node Exporter 的文本文件收集器而不是 Pushgateway 公开生成的指标。
3、pull 和 push 的定位
1. Prometheus 的拉取模型与短期任务的冲突
Prometheus 的核心设计是基于 拉取模型 (pull model)的,它会定期(通常是每15秒或更长时间)从目标服务抓取指标。然而,短期任务可能在两次抓取间隔之间就已经完成并终止了,这会导致:
- 任务可能在被抓取之前就已结束
- 指标数据完全丢失
- 无法监控这些短暂存在的服务
2. Push Gateway 的数据保留特性
Push Gateway 的一个重要特性是它会 保留 已推送的指标,直到这些指标被显式删除或被新值覆盖。这意味着:
- 短期任务可以在执行结束前将其最终状态推送到 Push Gateway
- Prometheus 可以在任务结束后的任何时间点抓取这些指标
- 指标不会因为任务的终止而丢失
3. Push Gateway 的局限性
虽然 Push Gateway 解决了短期任务的监控问题,但它不适合作为长期任务的通用解决方案,原因包括:
- 单点故障 :Push Gateway 本身可能成为系统的瓶颈
- 指标过时风险 :如果不正确管理,Push Gateway 可能保留过时的指标
- 丢失实例信息 :通过 Push Gateway,Prometheus 看到的是 Gateway 的实例,而非原始目标
- 违背 Prometheus 的设计理念 :Prometheus 的核心设计是基于拉取模型的
存储 storage
收集到信息后, prometheus 需要将数据存储下来, 这里 prometheus 提供两套 Storage 方案
Local Storage
prometheus 本地的时间序列数据库,大数据量水平扩展时,容易出现问题。
Remote storage
Remote Storage Integration
Prometheus’s local storage is limited to a single node’s scalability and durability. Instead of trying to solve clustered storage in Prometheus itself, Prometheus offers a set of interfaces that allow integrating with remote storage systems.
Prometheus 的本地存储仅限于单个节点的可扩展性和持久性。Prometheus 没有试图解决 Prometheus 本身的集群存储问题,而是提供了一组允许与远程存储系统集成的接口。
Prometheus integrates with remote storage systems in four ways:
Prometheus 以四种方式与远程存储系统集成:
- Prometheus can write samples that it ingests to a remote URL in a Remote Write format.
Prometheus 可以将其提取的示例以 Remote Write 格式写入远程 URL。 - Prometheus can receive samples from other clients in a Remote Write format.
Prometheus 可以接收来自其他客户端的 Remote Write 格式的样本。 - Prometheus can read (back) sample data from a remote URL in a Remote Read format.
Prometheus 可以以 Remote Read 格式从远程 URL 读取(回溯)样本数据。 - Prometheus can return sample data requested by clients in a Remote Read format.
Prometheus 可以以 Remote Read 格式返回客户端请求的示例数据。
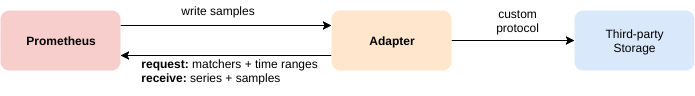
The remote read and write protocols both use a snappy-compressed protocol buffer encoding over HTTP. The read protocol is not yet considered as stable API.
远程读取和写入协议都使用基于 HTTP 的 snappy 压缩协议缓冲区编码。读取协议尚未被视为稳定的 API。
The write protocol has a stable specification for 1.0 version and experimental specification for 2.0 version, both supported by Prometheus server.
写入协议具有 1.0 版本的稳定规范 和 2.0 版本的实验性规范 ,均受 Prometheus 服务器支持。
For details on configuring remote storage integrations in Prometheus as a client, see the remote write and remote read sections of the Prometheus configuration documentation.
有关在 Prometheus 中作为客户端配置远程存储集成的详细信息,请参阅 remote write 和 远程读取 Prometheus 配置文档的部分。
Note that on the read path, Prometheus only fetches raw series data for a set of label selectors and time ranges from the remote end. All PromQL evaluation on the raw data still happens in Prometheus itself. This means that remote read queries have some scalability limit, since all necessary data needs to be loaded into the querying Prometheus server first and then processed there. However, supporting fully distributed evaluation of PromQL was deemed infeasible for the time being.
请注意,在读取路径上,Prometheus 仅从远程端获取一组标签选择器和时间范围的原始序列数据。对原始数据的所有 PromQL 评估仍然在 Prometheus 本身中进行。这意味着远程读取查询具有一定的可扩展性限制,因为所有必要的数据都需要先加载到查询的 Prometheus 服务器中,然后再在那里进行处理。但是,支持 PromQL 的完全分布式评估暂时被认为不可行。
Prometheus also serves both protocols. The built-in remote write receiver can be enabled by setting the --web.enable-remote-write-receiver command line flag. When enabled, the remote write receiver endpoint is /api/v1/write. The remote read endpoint is available on /api/v1/read.
Prometheus 也提供这两种协议。可以通过设置 --web.enable-remote-write-receiver 命令行标志来启用内置的远程写入接收器。启用后,远程写入接收器终端节点为 /api/v1/write。远程读取终端节点位于 /api/v1/read 上。
Existing Integration
对于远程写入来讲,存在一些集成方案,来帮助实现存储的水平扩展和高可用。
比较出名得有
- Grafana Mimir: read and write
- Cortex: read and write
- VictoriaMetrics: write
- InfluxDB: read and write
- etc
选型对比
Prometheus 的水平扩展服务 Mimir 和 Cortex
VictoriaMetrics
开源协议 方面
Cortex、VictoriaMetrics 是 Apache License 2.0
Mimir 是 GNU Affero General Public License v3.0
- Mimir 的协议不够友好。但商业使用上,只要不是对外提供服务,使用本身问题不大。
总结
在生产上使用时,
抛开现在不积极维护的 Cortex,
最好的方案是 VictoriaMetrics, 可扩展性强,并且性能最好,协议也友好。
不过考虑看板层面唯一解还是 Grafana, 所以使用 Mimir 也是很好的选择。