前言
先把可观测性Observability 内的多篇文章读完,相关概念有一定理解后。
在理解下面的方案
方案
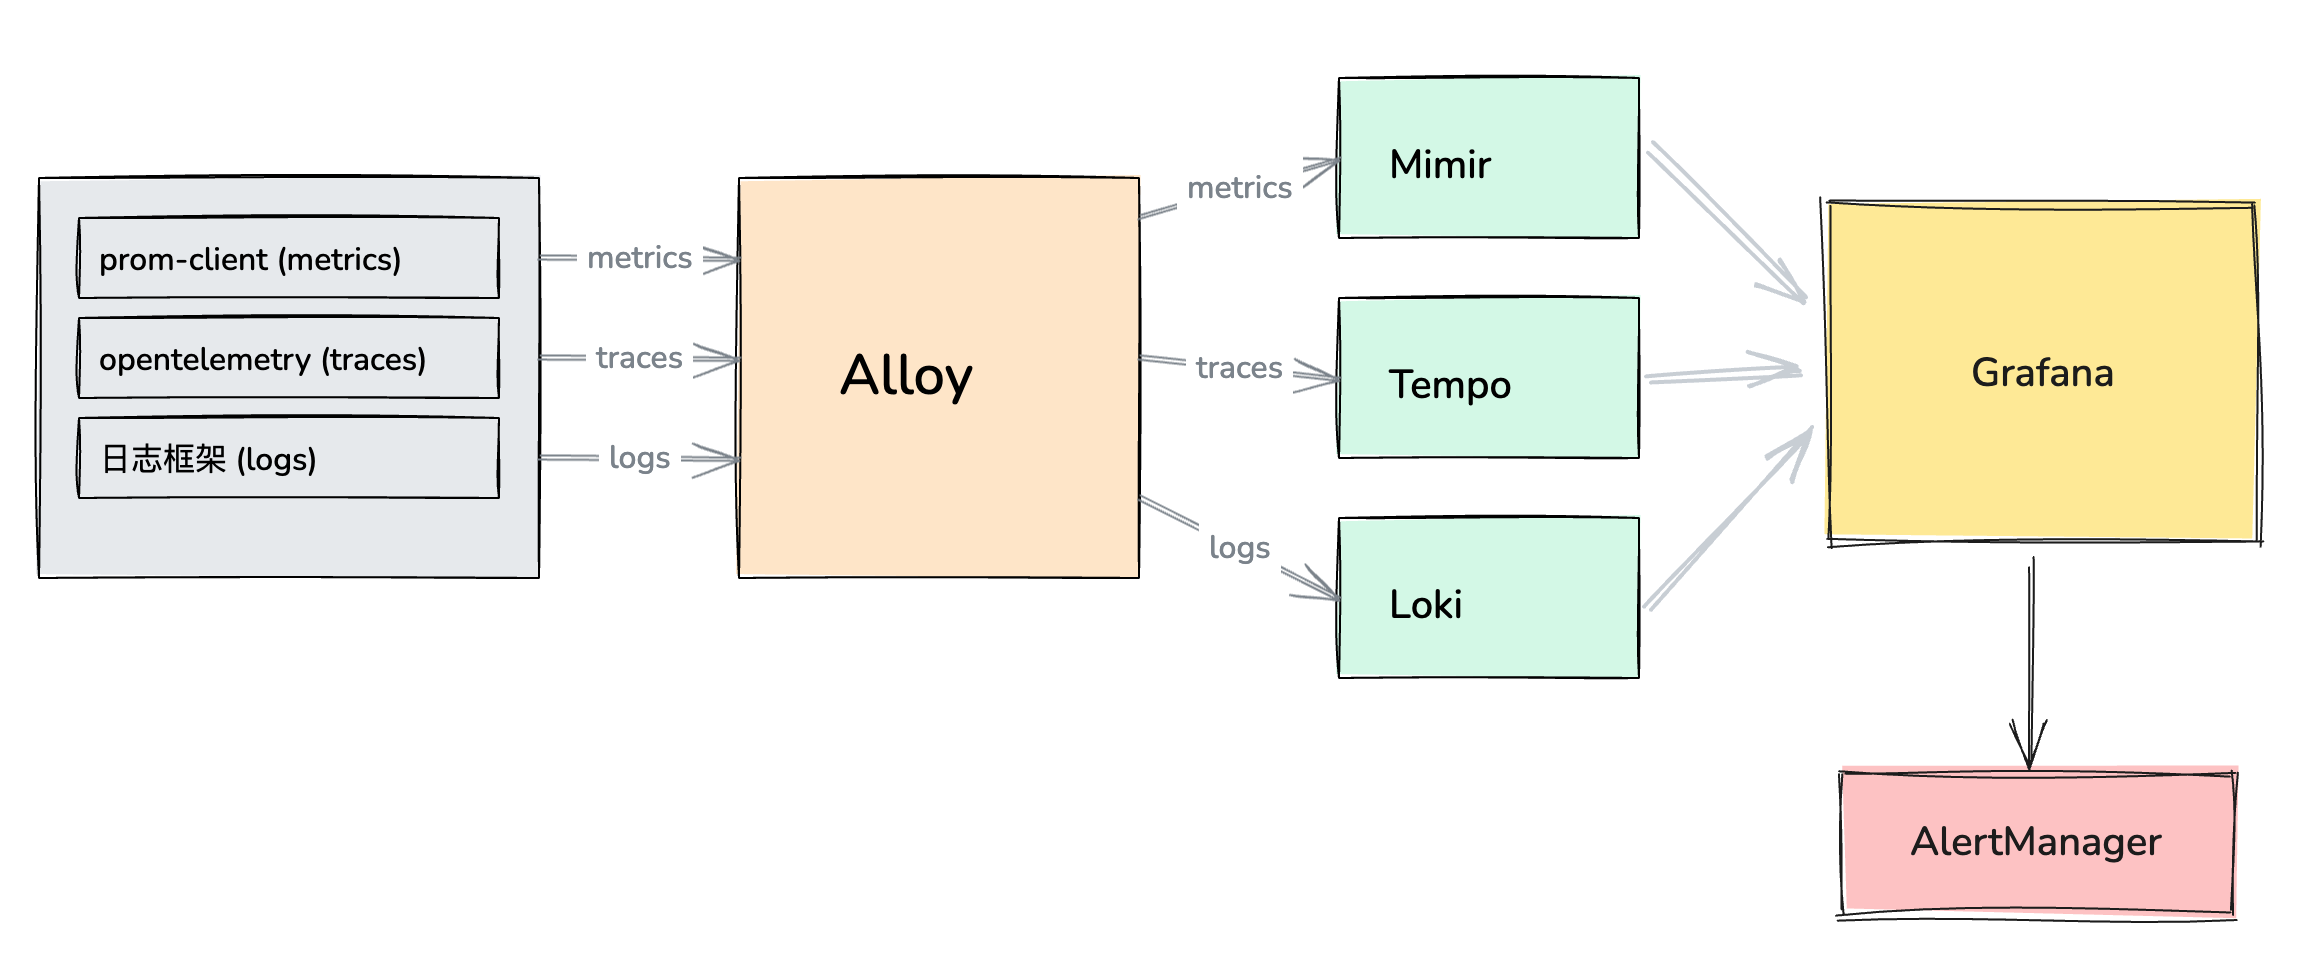
数据收集
metrics
通过 prom-client 暴露 /metrics 接口, 让 Alloy 抓取, 写入 Mimir 中
traces
通过 otel-sdk 捕获 trace 信息, 通过 grpc/http 方式 push, 到 Alloy 中, 然后 Alloy 写入 Tempo 中
logs
在日志框架层面封装, 推送 log 到 Alloy 的 loki 模块, 然后再写入 Loki 中
数据展示
通过 Grafana 的看板进行相关数据的展示
数据预警
通过 Grafana 的 Alert 功能, 或者 AlertManager 的配置进行数据的预警
方案参考
- GitHub - 3dot141/nodejs-opentelemetry-tempo: Project demonstrating Complete Observability Stack utilizing Prometheus, Loki (For distributed logging), Tempo (For Distributed tracing, this basically uses Jaeger Internally), Grafana for NodeJs based applications (With OpenTelemetry auto / manual Instrumentation) involving microservices with DB interactions.
- GitHub - 3dot141/intro-to-mltp: Introduction to Metrics, Logs, Traces and Profiles session companion code.
其他注意点
数据保留策略
retention: 保留
因为硬盘空间有限,所以需要考虑数据留存的天数
比如 Tempo 默认策略是
compactor:

    # Optional. Disables backend compaction. Default is false.
    # Note: This should only be used in a non-production context for debugging purposes. This will allow blocks to say in the backend for further investigation if desired.
    [disabled: <bool>]

    ring:
        kvstore: <KVStore config>
            [store: <string> | default = memberlist]
            [prefix: <string> | default = "collectors/" ]

    compaction:

        # Optional. Duration to keep blocks. Default is 14 days (336h).
        [block_retention: <duration>]
compactor.block_retention: 336h 也就是 14d
附录
Grafana Alloy
Grafana Loki
Grafana Mimir
Grafana Tempo
Grafana K6